


Performance Tuning
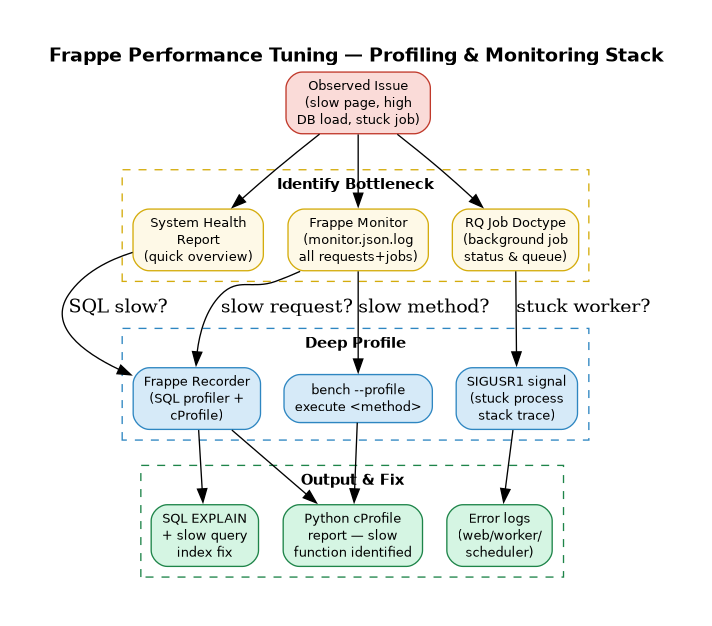
Performance issues in ERPNext typically fall into three categories: slow SQL queries, slow Python execution, and stuck or backed-up background jobs. Frappe provides a built-in profiling and monitoring stack to diagnose each of these without needing external APM tools.
1. System Health Report — First Stop
Before diving into profiling, run the System Health Report to get a quick overview of the system state. Search System Health Report in the Awesomebar.
It covers:
| Area | What it checks |
|---|---|
| Background Jobs | Queue depth, failed jobs |
| Scheduler | Whether the scheduler is running |
| Database | Connection health, DB size |
| Cache | Redis connectivity |
| Emails | Email queue status |
| Error Logs | Recent unhandled exceptions |
| Storage | Disk usage |
| Backups | Last successful backup timestamp |
| Users | Active sessions |
Use this as a quick triage before profiling.
2. Frappe Recorder — SQL Profiler
Frappe Recorder is the primary profiling tool. It captures every HTTP request and background job along with all SQL queries, their duration, stack traces, and EXPLAIN output.
When to use it
- A DocType is slow to save or load
- A report takes too long to generate
- You suspect N+1 query problems
- You want to find missing indexes
How to use it
- Login as Administrator → search
Recorderin Awesomebar → click Start - Configure what to record (requests / background jobs / filter by path)
- Perform the slow action in another tab
- Return to Recorder → click Stop
- Browse the captured requests, sorted by duration or query count
What each captured request shows
| Field | Description |
|---|---|
path |
URL path or job name |
cmd |
Dotted Python method path |
duration |
Total request time (includes recorder overhead) |
num queries |
Number of SQL queries fired |
time in queries |
Actual DB time (close to real-world) |
| SQL queries table | Every query with duration, stack trace, EXPLAIN |
Note: Total
durationincludes recorder overhead and is not representative of real performance.time in queriesis accurate.
Click any SQL row to see:
- Query duration
- Stack trace (which Python line triggered it)
- EXPLAIN output — use this to identify missing indexes or full table scans
Python Profiling via Recorder
Enable cProfiler when starting the Recorder to also capture Python-level profiling output. This shows cumulative time per function call, helping identify slow Python code beyond SQL.
⚠️ cProfiler adds significant overhead. Enable only for targeted debugging, not on production traffic. Use path filters to limit scope.
Exporting & Importing Captures
Recorder captures can be exported as JSON and imported on another site for analysis:
- Recorder page → Menu (⋯) → Export → downloads
.json - On target site → Import → select the JSON file
3. Profiling Functions via Bench
For profiling a specific Python method without using the UI:
# Profile a specific method
bench --site [sitename] --profile execute erpnext.projects.doctype.task.task.set_tasks_as_overdue

# Run any DB method
bench --site [sitename] execute frappe.db.get_database_size
The --profile flag runs Python's cProfile and prints a cumulative time report after execution — useful for isolated function benchmarking in development.
4. Frappe Monitor — Request & Job Logging
Frappe Monitor logs metadata for every HTTP request and background job to a structured log file. Enable it by adding to site_config.json:
{
  "monitor": 1
}
Logs are written to logs/monitor.json.log. Each entry is a JSON object:
// HTTP request entry
{
  "duration": 807142,
  "request": {
    "ip": "127.0.0.1",
    "method": "GET",
    "path": "/api/method/frappe.realtime.get_user_info",
    "status_code": 500
  },
  "timestamp": "2026-03-20 09:37:17",
  "transaction_type": "request"
}

// Background job entry
{
  "duration": 1364,
  "job": {
    "method": "frappe.ping",
    "scheduled": false,
    "wait": 90204
  },
  "timestamp": "2026-03-20 09:37:40",
  "transaction_type": "job"
}
Use this log with jq, grep, or a log aggregator (Loki, Datadog) to:
- Find requests exceeding a duration threshold
- Identify endpoints with high error rates
- Track background job wait times
5. Background Job Monitoring — RQ
Frappe uses Redis Queue (RQ) for async background tasks. Two built-in virtual DocTypes let you monitor the queue without shell access:
RQ Worker
Shows all active background workers: name, status, job counts (success / failed), and current job.
RQ Job
Lists all queued and running jobs. Filter by queue (default, long, short) and status (queued, started, failed). Click any job to see full details including arguments and error traceback.
Debugging a Stuck Worker
If a worker process appears hung, send it SIGUSR1 to print the current stack trace of all threads to stderr:
kill -SIGUSR1
Output is written to the relevant log file:
| Worker type | Log file |
|---|---|
| Web workers | bench/logs/web.error.log |
| Background workers | bench/logs/worker.error.log |
| Scheduler | bench/logs/schedule.error.log |
6. Common Performance Issues & Fixes
| Symptom | Likely cause | Fix |
|---|---|---|
| DocType slow to save | Missing DB index, N+1 queries in hooks | Use Recorder → EXPLAIN → add index |
| List view slow to load | No index on filter fields | Add index via Custom Field settings |
| Report times out | Full table scan, large dataset | Paginate, add filters, use SQL Report with indexed columns |
| Background job queue grows | Too few workers, slow job | Scale workers via bench setup-manager or optimise job |
| High memory on workers | Memory leak in custom app | Profile with memory_profiler, check for large in-memory caches |
| Scheduler not running | Supervisor not watching scheduler process | Check supervisorctl status + restart scheduler |
7. Performance Best Practices for Custom Development
- Avoid
frappe.get_list()in loops — use a singlefrappe.db.sql()with a JOIN instead - Use
frappe.db.get_value()notfrappe.get_doc()when you only need one field - Index Link fields that are frequently filtered in list views
- Use
frappe.enqueue()for any operation that may take >2 seconds — never block the web request - Cache expensive computations using
frappe.cache().get_value()/set_value() - Limit child table rows — large child tables (>500 rows) significantly slow form load; paginate or use a separate DocType
- Use
frappe.db.auto_commit_on_many_writesfor bulk insert operations to avoid per-row commits
